 VedaWatch
Recovery & Apple Watch
What is a good HRV? Normal HRV by age and on Apple Watch
What is a good HRV? Published norms by age and sex, SDNN vs RMSSD, how to read your Apple Watch number, and why your own baseline and trend matter more.
By VedaWatch editorial team · · 10 min read
The short answer
There's no single good HRV. In short resting recordings, healthy adults average about 50 ms SDNN and 42 ms RMSSD, and typical SDNN falls with age, from about 49 to 50 ms at 25 to 34 to about 28 to 30 ms at 65 to 74. Apple Watch reports SDNN. A good HRV is one that holds steady or rises against your own baseline.
What is a good HRV?
A good heart rate variability (HRV) is one that is normal for your age and, more importantly, normal for you. There is no cut-off in milliseconds that marks a healthy heart, because HRV depends heavily on age, on how it was measured, and on your own physiology.
Published norms still give a useful frame. A systematic review of 44 studies with 21,438 healthy adults (Nunan and colleagues, 2010) put the average for short resting recordings at 50 ms (SD 16) for SDNN and 42 ms (SD 15) for RMSSD. Those are averages across all ages, though, and the spread around them is wide.
Two details change how you should read any HRV chart, including the one in Apple Health. First, SDNN and RMSSD are different calculations and give different numbers. Second, a 24-hour recording gives much higher values than a few minutes at rest. Most of the confusing "normal HRV" figures online mix these up, so the next two sections sort them out before we get to the age tables.
SDNN vs RMSSD: which one does Apple Watch show?
Both measure how much the gap between heartbeats changes, in milliseconds. SDNN is the standard deviation of all normal beat-to-beat intervals in a recording, so it picks up both slow and fast swings. RMSSD looks only at the difference between each beat and the next, which makes it the main time-domain measure of vagal, or parasympathetic, activity (Shaffer and Ginsberg, 2017). The two are related, but you can't convert one into the other.
The Heart Rate Variability figure Apple Watch saves to Apple Health is SDNN. Apple's HealthKit documentation describes it as a sample type that "measures the standard deviation of heartbeat intervals". So when you compare your Apple Watch number with a table, use SDNN rows, not RMSSD rows.
There is one 2026 wrinkle. Apple says Apple Watch Series 12 and Ultra 4 measure HRV as often as every five minutes and provide two variants: Recovery HRV, which Apple says is best for daily signals of stress and recovery, and overall HRV, for broader health. Apple's developer documentation also lists a new RMSSD data type from iOS 27. As of November 2026, Apple hasn't published how Recovery HRV is calculated, so don't assume it equals RMSSD from a study, and don't mix it with older SDNN readings when you compare trends.
Many chest-strap and ring apps show RMSSD. That's one reason the same night can produce noticeably different numbers on two devices, and why comparing your Apple Watch figure with a friend's from another device tells you very little.
Why some HRV norms are over 100 ms
If you have seen "healthy HRV is over 100 ms", that comes from 24-hour Holter recordings, not from a watch reading. Over a whole day your heart rate swings with sleep, meals, walking and stairs, so the standard deviation of every interval is far larger than in a few quiet minutes. Shaffer and Ginsberg summarise the long-standing 24-hour SDNN bands as below 50 ms unhealthy, 50 to 100 ms compromised, and above 100 ms healthy, and cite a 24-hour study that found SDNN of 160 ± 40 ms in men and 147 ± 36 ms in women.
The same review is explicit that longer recordings yield higher HRV, so SDNN values from recordings of different lengths shouldn't be compared. Apple Watch takes short readings when you're still, many of them at night. That puts your number in the same family as short-term (around 5-minute) resting norms, not 24-hour ones. A 45 ms Apple Watch reading is not "compromised" just because it's under 50.
Even short-term norms are only a rough match. Research tables usually come from a chest ECG while lying down in a quiet lab, while your watch uses an optical sensor on your wrist in whatever position you're in. Treat the tables below as a guide to the typical range for your age, not a pass mark.
Normal HRV by age and sex
The clearest age-and-sex breakdown for short recordings comes from Voss and colleagues (2015), who analysed 5-minute resting ECGs, taken lying down after 5 to 10 minutes of rest, from 1,906 healthy adults aged 25 to 74 in the German KORA S4 study (782 women, 1,124 men). These are their means ± one standard deviation, in milliseconds:
- Age 25 to 34: women SDNN 48.7 ± 19.0, RMSSD 42.9 ± 22.8. Men SDNN 50.0 ± 20.9, RMSSD 39.7 ± 19.9.
- Age 35 to 44: women SDNN 45.4 ± 20.5, RMSSD 35.4 ± 18.5. Men SDNN 44.6 ± 16.8, RMSSD 32.0 ± 16.5.
- Age 45 to 54: women SDNN 36.9 ± 13.8, RMSSD 26.3 ± 13.6. Men SDNN 36.8 ± 14.6, RMSSD 23.0 ± 10.9.
- Age 55 to 64: women SDNN 30.6 ± 12.4, RMSSD 21.4 ± 11.9. Men SDNN 32.8 ± 14.7, RMSSD 19.9 ± 11.1.
- Age 65 to 74: women SDNN 27.8 ± 11.8, RMSSD 19.1 ± 11.8. Men SDNN 29.6 ± 13.2, RMSSD 19.1 ± 10.7.
How to read your Apple Watch HRV against the table
Look at the standard deviations before the averages. In every age group the standard deviation is roughly 11 to 23 ms, which is about as big as the drop from your twenties to your fifties. In other words, healthy people of the same age differ from each other far more than one person differs from week to week. Nunan's review noted very large differences between individuals in healthy samples, too.
A worked example: say you're 52 and your Apple Watch HRV has averaged 34 ms over the past month. The 45 to 54 rows show SDNN of 36.9 ± 13.8 ms for women and 36.8 ± 14.6 ms for men, so you're close to the middle. Now say you're 30 with the same 34 ms. The 25 to 34 mean is about 49 to 50 ms with a spread of about 19 to 21 ms, so you're below average but still inside one standard deviation, a range that covers a large share of healthy people.
Use a typical value, not one reading. Take the average of a few weeks of readings in Apple Health (Browse, then Heart, then Heart Rate Variability, and switch to the month view; labels can vary by iOS version), and compare that with your age row. Expect it to sit a little apart from the table anyway, because your watch's short wrist readings aren't taken the way the study's 5-minute lab ECGs were.
What about sex? Differences are smaller than most charts suggest. Voss found no significant SDNN difference between women and men, only a trend toward lower SDNN in women, with differences converging after 45 and disappearing after 55. In 24-hour recordings, Umetani and colleagues (1998) found HRV lower in women than men under 30, a gap that narrowed after 30 and disappeared after 50.
How much does HRV drop with age?
HRV falls with age in every large dataset, and the measure you use changes the shape of the decline. In Voss's data, the biggest step came between the 35 to 44 and 45 to 54 groups: average SDNN fell by about 8 ms in both sexes, and RMSSD by about 9 ms.
Umetani's study of 260 healthy people aged 10 to 99 followed this across nine decades with 24-hour recordings. 24-hour SDNN declined only gradually, reaching about 60% of second-decade values by the tenth decade. RMSSD dropped much faster, reaching 47% of its second-decade level by the sixth decade and then levelling off. Shaffer and Ginsberg also describe data in which RMSSD fell from 40 to 60 and then rose again after 70.
So a lower number at 60 than at 30 is expected and isn't a sign that something is wrong. It's also why comparing yourself with a younger partner, a training group, or a screenshot online is unfair to you. The only comparison that removes age, sex, genetics and device differences at once is you against your own history.
Why your own baseline matters more than the norms
Population tables answer "am I roughly typical for my age?". They can't answer the question most people actually have, which is "am I recovered today?" or "is my health moving in the right direction?". That needs your own baseline: your typical HRV, measured the same way, on the same watch, over recent weeks.
Sports scientists who monitor elite athletes make the same point. Plews and colleagues (2013) argue that HRV needs long-term monitoring to learn each athlete's individual HRV "fingerprint", and recommend averaging readings rather than reacting to single days. If that's the advice for Olympic athletes with lab support, it applies even more to a wrist sensor taking short readings.
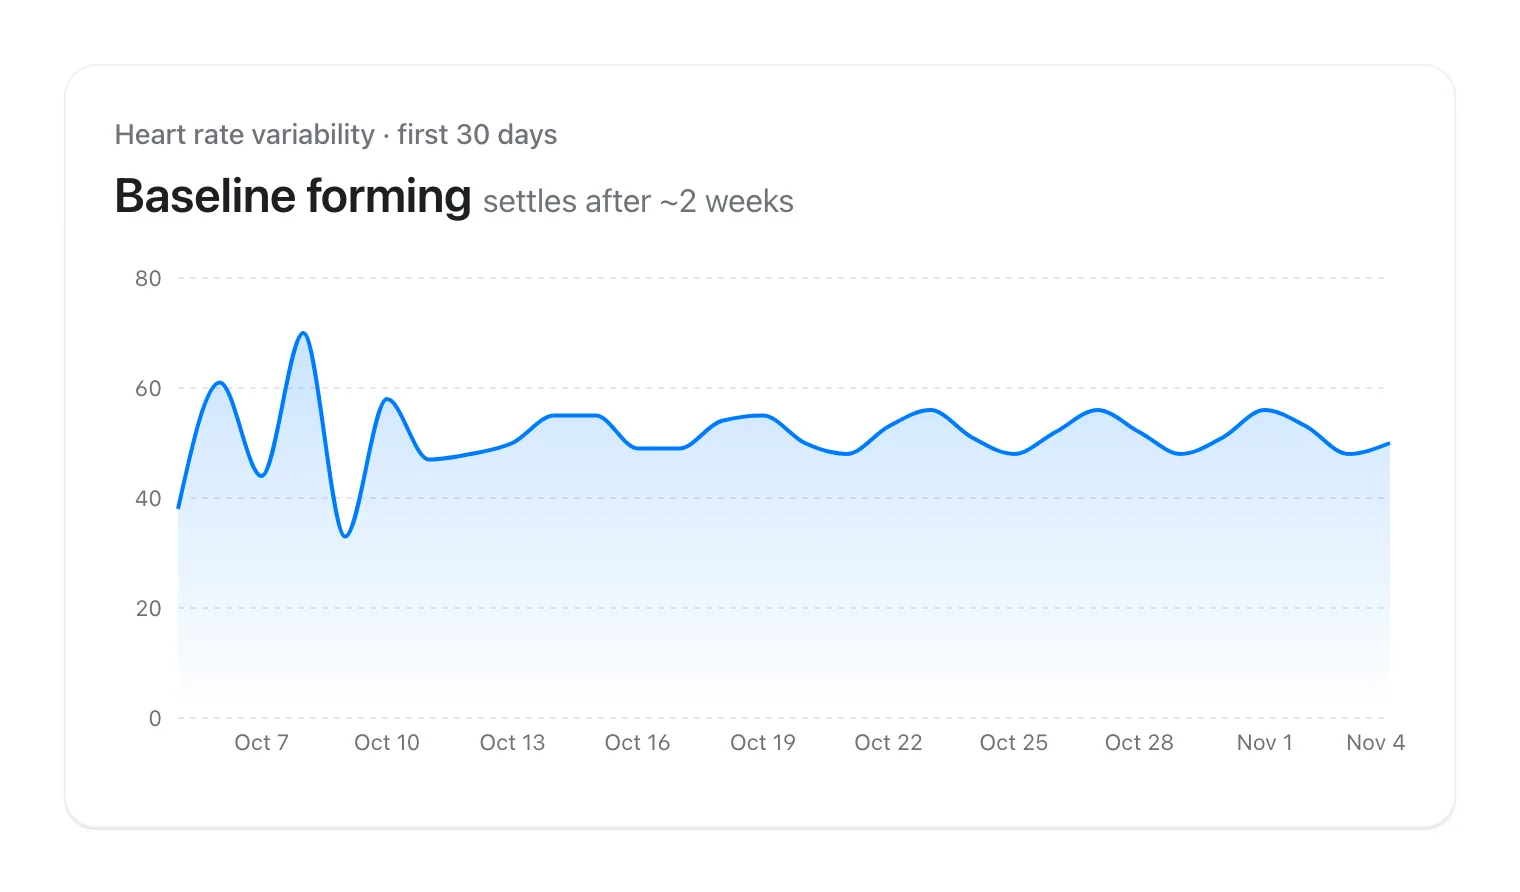
Your baseline also needs time to form. The first week or two of readings on a new watch tend to bounce around before settling, so give it a few weeks of regular overnight wear before you judge your normal.
What a good HRV trend looks like
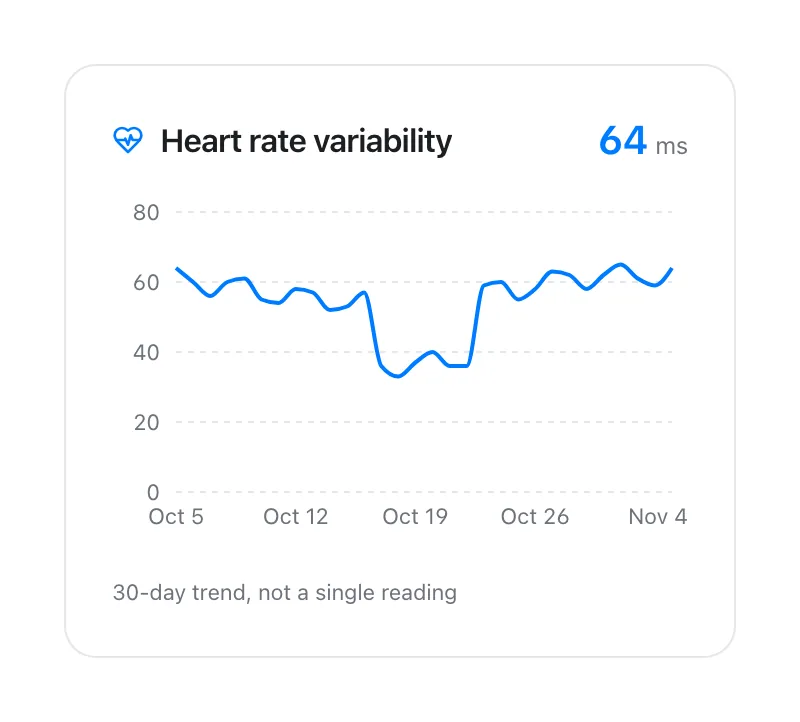
Because single readings are noisy, judge HRV by its trend, using weekly averages or a rolling average. Here's what generally counts as reassuring, and what's worth a closer look:
- Good: a weekly average that holds steady, or creeps up over weeks as your sleep, fitness or stress improves.
- Good: day-to-day scatter around that average. One low or high night on its own means very little.
- Normal: a short dip after a hard workout, a late night, alcohol or travel that comes back within a few days.
- Worth a closer look: a drop that lasts a week or more, especially with a higher resting heart rate, poorer sleep or feeling run-down. Ease off training and prioritise sleep while you watch it.
- Not automatically good: a single unusually high reading. Measurement noise or irregular beats can inflate a short reading, so look for a rise that holds.
Does a rising HRV always mean you're fitter?
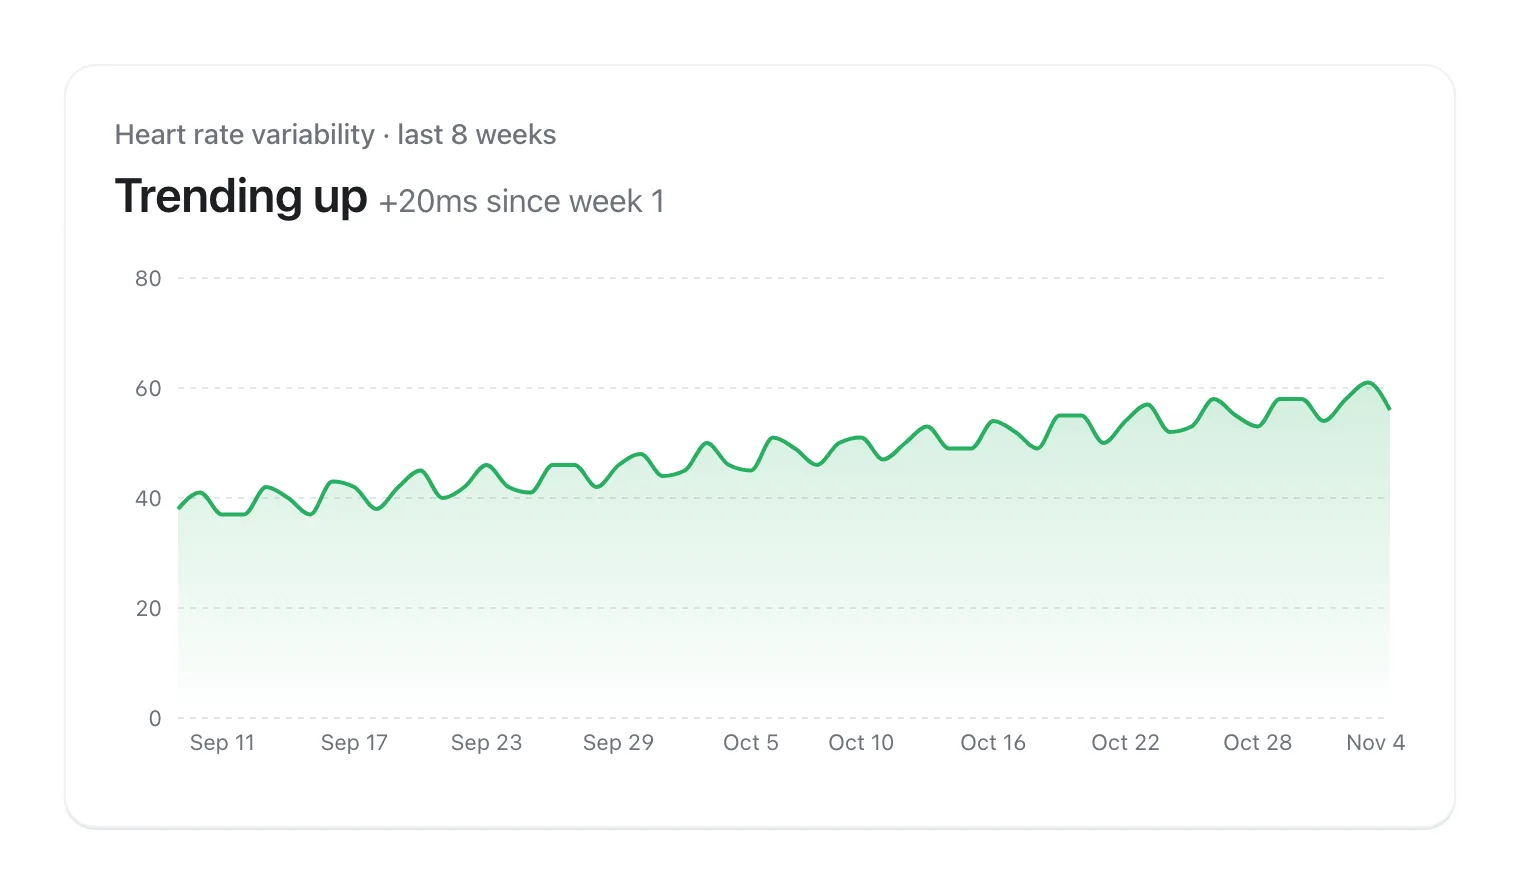
Often, but not always. On average, a rising HRV alongside a steady or falling resting heart rate is a reassuring sign for most people. But Plews and colleagues describe elite endurance athletes whose HRV went down as their fitness went up, partly because HRV can saturate in very fit people, so they read HRV changes alongside fitness, freshness and resting heart rate rather than on their own.
For everyday users, the practical rule is to look at HRV with context: your sleep, resting heart rate, training load and how you feel. A slow climb like the one below, over two months of steadier sleep and training, is the kind of trend worth celebrating. A sudden, large jump within a few days deserves some suspicion: check whether anything changed in how it was measured, such as a new watch, a looser fit or a software update, before reading it as a change in you.
HRV is a wellness signal, not a diagnosis. Talk to a doctor if a low or falling HRV comes with symptoms such as chest pain, palpitations, dizziness, fainting or unusual breathlessness, if you have a heart condition, or if a new medicine might be affecting your heart rate. A watch number alone can't rule a problem in or out.
How VedaWatch helps you read your HRV
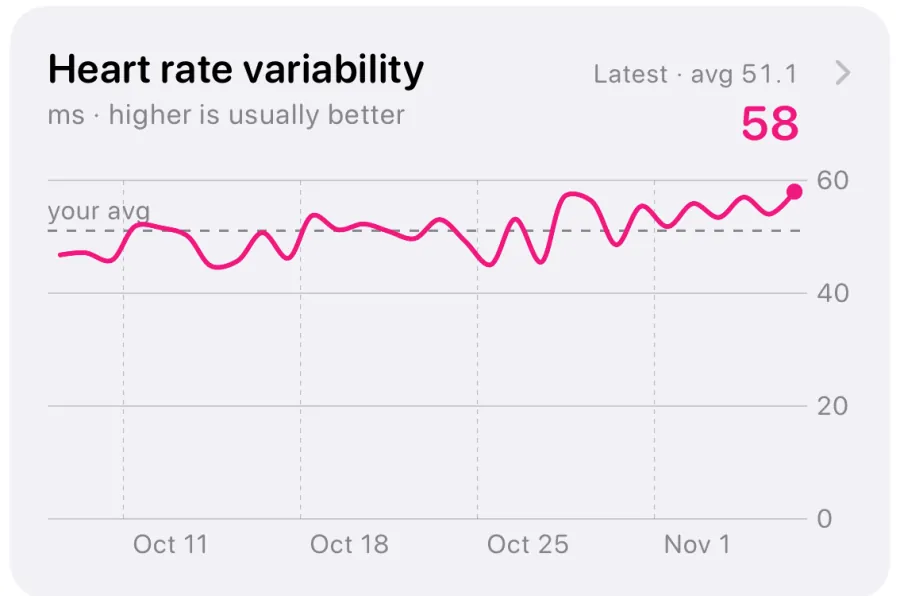
VedaWatch reads the SDNN values your Apple Watch saves to Apple Health and shows them against your own history rather than against a population chart. On the Recover tab, the Heart rate variability card plots your recent readings with a dashed line for your average, so you can see at a glance whether today is above or below your normal.
Tap the card for the detail view. It compares your last 7 days with "your usual", the average of your earlier readings from the last 90 days, and shows your normal range as that average plus or minus one standard deviation. You'll see one of three verdicts: In line with your usual, Better than your usual, or Below your usual. A change only counts once it's bigger than both 3 ms and half of your normal day-to-day swing, so ordinary noise doesn't get flagged. The screen deliberately has no age bands for HRV, because values vary so much between people.
HRV also feeds VedaWatch's readiness score, together with resting heart rate and sleep. Its reasons spell out when today's HRV is more than 10% above or below your recent baseline. If you want to know what moves your HRV, the Daily tags journal compares your next-morning HRV after tagged days, such as alcohol or a stressful day, with ordinary days.
Frequently asked questions
Is an Apple Watch HRV of 20 ms bad?
It depends on your age. In Voss's 65 to 74 group, average short-term SDNN was about 28 to 30 ms with a spread of about 12 to 13 ms, so 20 ms is within the usual range there, while at 30 it would be on the low side. A consistently low reading together with symptoms is worth raising with a doctor.
Can I compare my Apple Watch HRV with an app that uses a chest strap?
Only loosely. Apple Health's HRV is SDNN from short wrist readings, while many strap and ring apps show RMSSD, which is a different calculation, often from a different time window. Compare each device with its own history instead.
Why is my HRV much lower than the 100 ms I read about online?
Figures above 100 ms usually come from 24-hour SDNN, which is much higher than short resting readings because it captures a whole day of heart rate swings. Your Apple Watch takes short readings, so compare it with short-term norms.
Is a higher HRV always better?
Apple says higher variability is generally associated with better recovery, but higher isn't automatically better for every reading. A one-off spike can come from noise or irregular beats, so look for a higher weekly average that holds.
What time of day should I judge my HRV?
Readings taken in similar conditions are the most comparable, and for most people that means overnight or first thing in the morning. Daytime readings after activity, coffee or stress vary more, so don't compare them with overnight values.
Related guides
- Apple Watch HRV: how to check it and understand your trends
- How long it takes to establish your HRV baseline
- How to improve your HRV: habits that actually move the number
- Is Apple Watch HRV accurate? What the validation studies actually show
- Why is my HRV so low? Causes of a sudden drop and what to check
- Apple Watch vs Oura Ring: comparing HRV and recovery tracking
Sources & further reading
- Nunan D, Sandercock GRH, Brodie DA (2010). A quantitative systematic review of normal values for short-term heart rate variability in healthy adults. Pacing and Clinical Electrophysiology 33(11):1407-1417. doi:10.1111/j.1540-8159.2010.02841.x
- Voss A, Schroeder R, Heitmann A, Peters A, Perz S (2015). Short-term heart rate variability: influence of gender and age in healthy subjects. PLoS ONE 10(3):e0118308. doi:10.1371/journal.pone.0118308
- Umetani K, Singer DH, McCraty R, Atkinson M (1998). Twenty-four hour time domain heart rate variability and heart rate: relations to age and gender over nine decades. Journal of the American College of Cardiology 31(3):593-601. doi:10.1016/S0735-1097(97)00554-8
- Shaffer F, Ginsberg JP (2017). An overview of heart rate variability metrics and norms. Frontiers in Public Health 5:258. doi:10.3389/fpubh.2017.00258
- Plews DJ, Laursen PB, Stanley J, Kilding AE, Buchheit M (2013). Training adaptation and heart rate variability in elite endurance athletes: opening the door to effective monitoring. Sports Medicine 43(9):773-781. doi:10.1007/s40279-013-0071-8
- Apple Developer Documentation: heartRateVariabilitySDNN (HealthKit)
- Apple Developer Documentation: heartRateVariabilityRMSSD (HealthKit, iOS 27)
- Apple Newsroom (September 9, 2026). Apple advances health and fitness capabilities using Apple Intelligence
This guide is educational, not medical advice, and has not been clinically reviewed. VedaWatch is not a medical device. If you have symptoms or concerns about your heart or health, contact a qualified healthcare professional.
Put your trends in perspective.
Explore HRV, sleep, and recovery with VedaWatch on your iPhone.
Download VedaWatch on the App Store →